Global Statistics & Insights

An unparalleled, comprehensive tracking engine analyzing every aspect of your wake-up patterns.

Overview

ReAlarm doesn't just wake you up; it learns how you sleep. The app features a massive 'Global Statistics' engine that continuously monitors your morning behavior across six immense data pillars: Overview, Trends, Performance, Logs, Achievements, and Insights.

By meticulously graphing your dismissal speeds, snoozing habits, challenge completion rates, and daily consistency, ReAlarm transitions from being a simple clock into a powerful, data-driven morning coach. Understanding your habits is the first step to finally permanently conquering them.

Capabilities

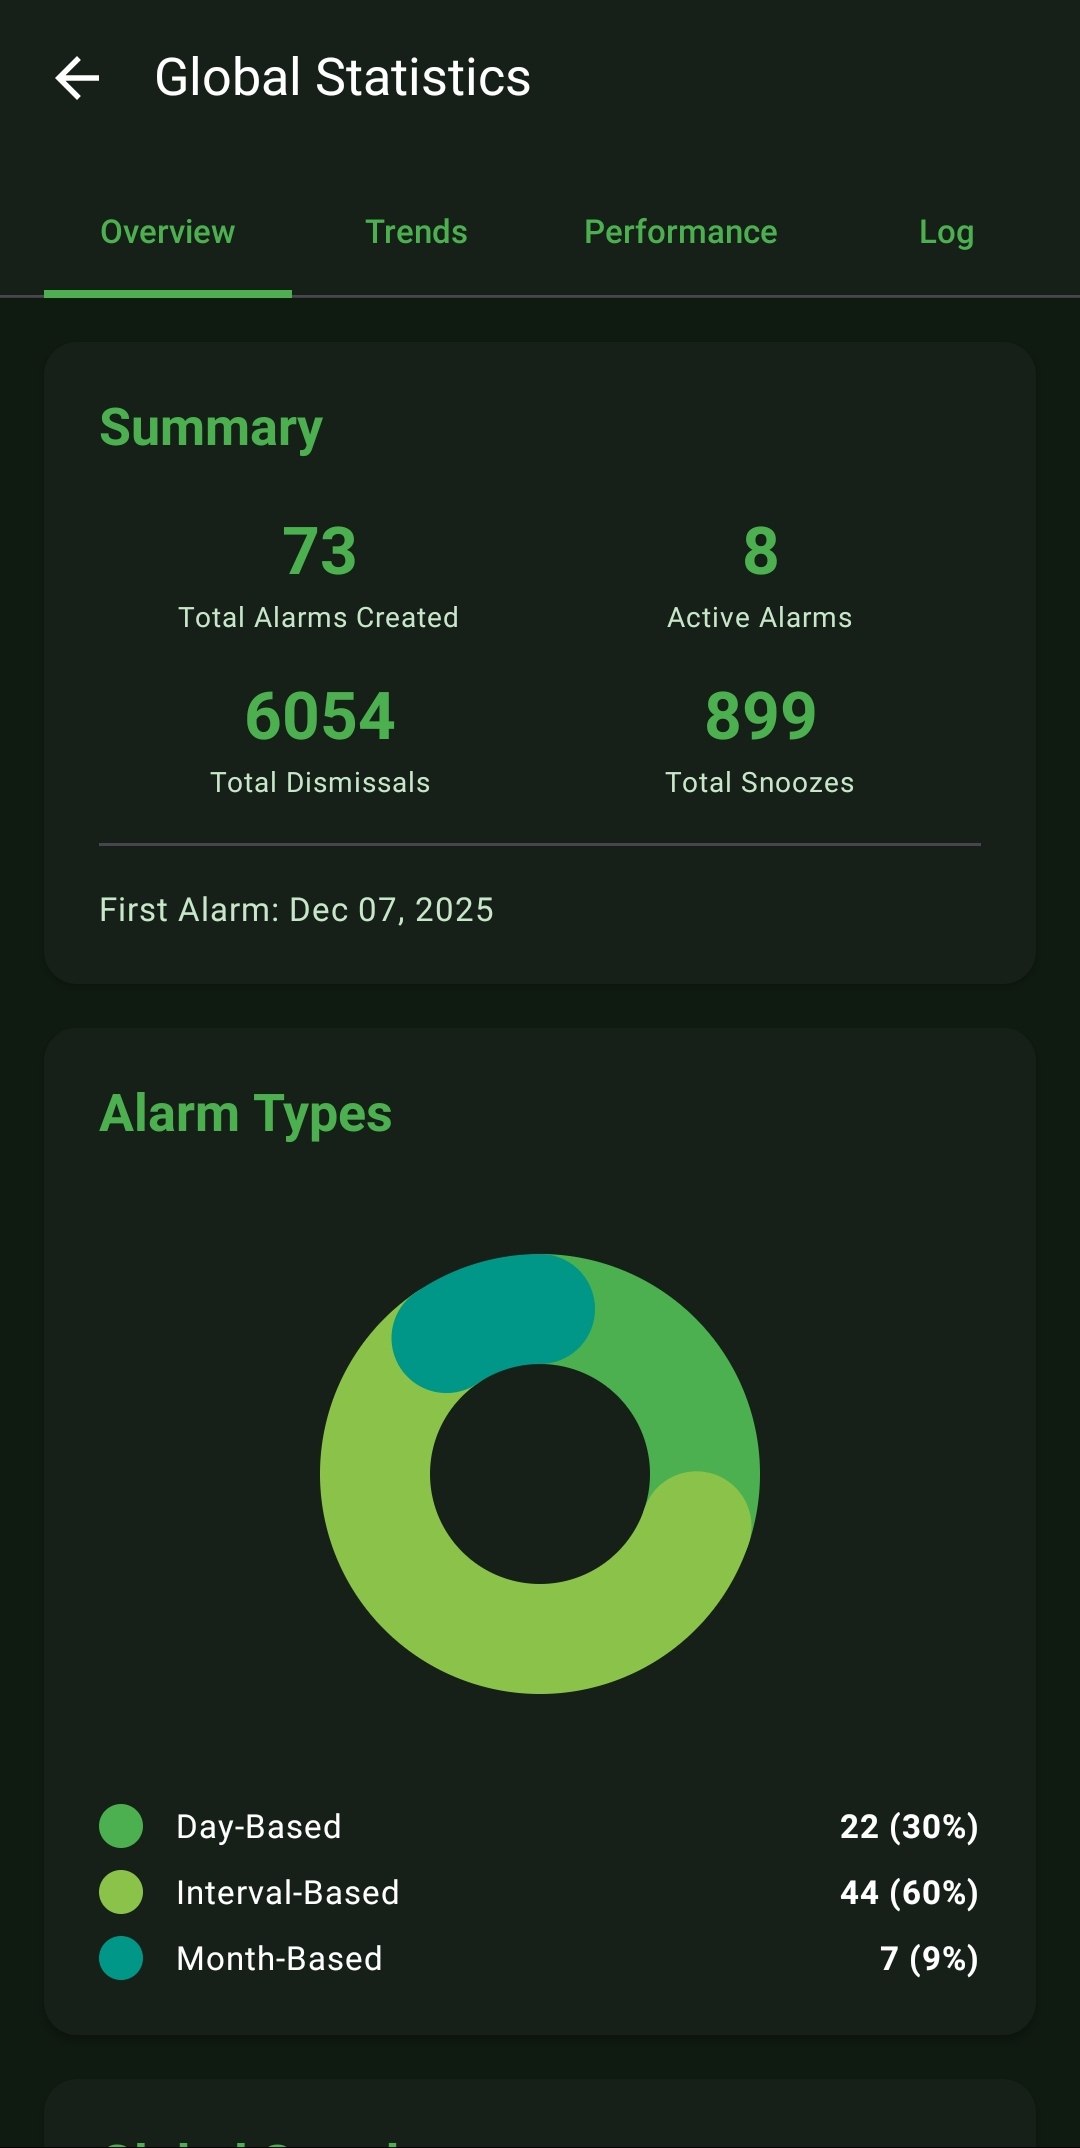
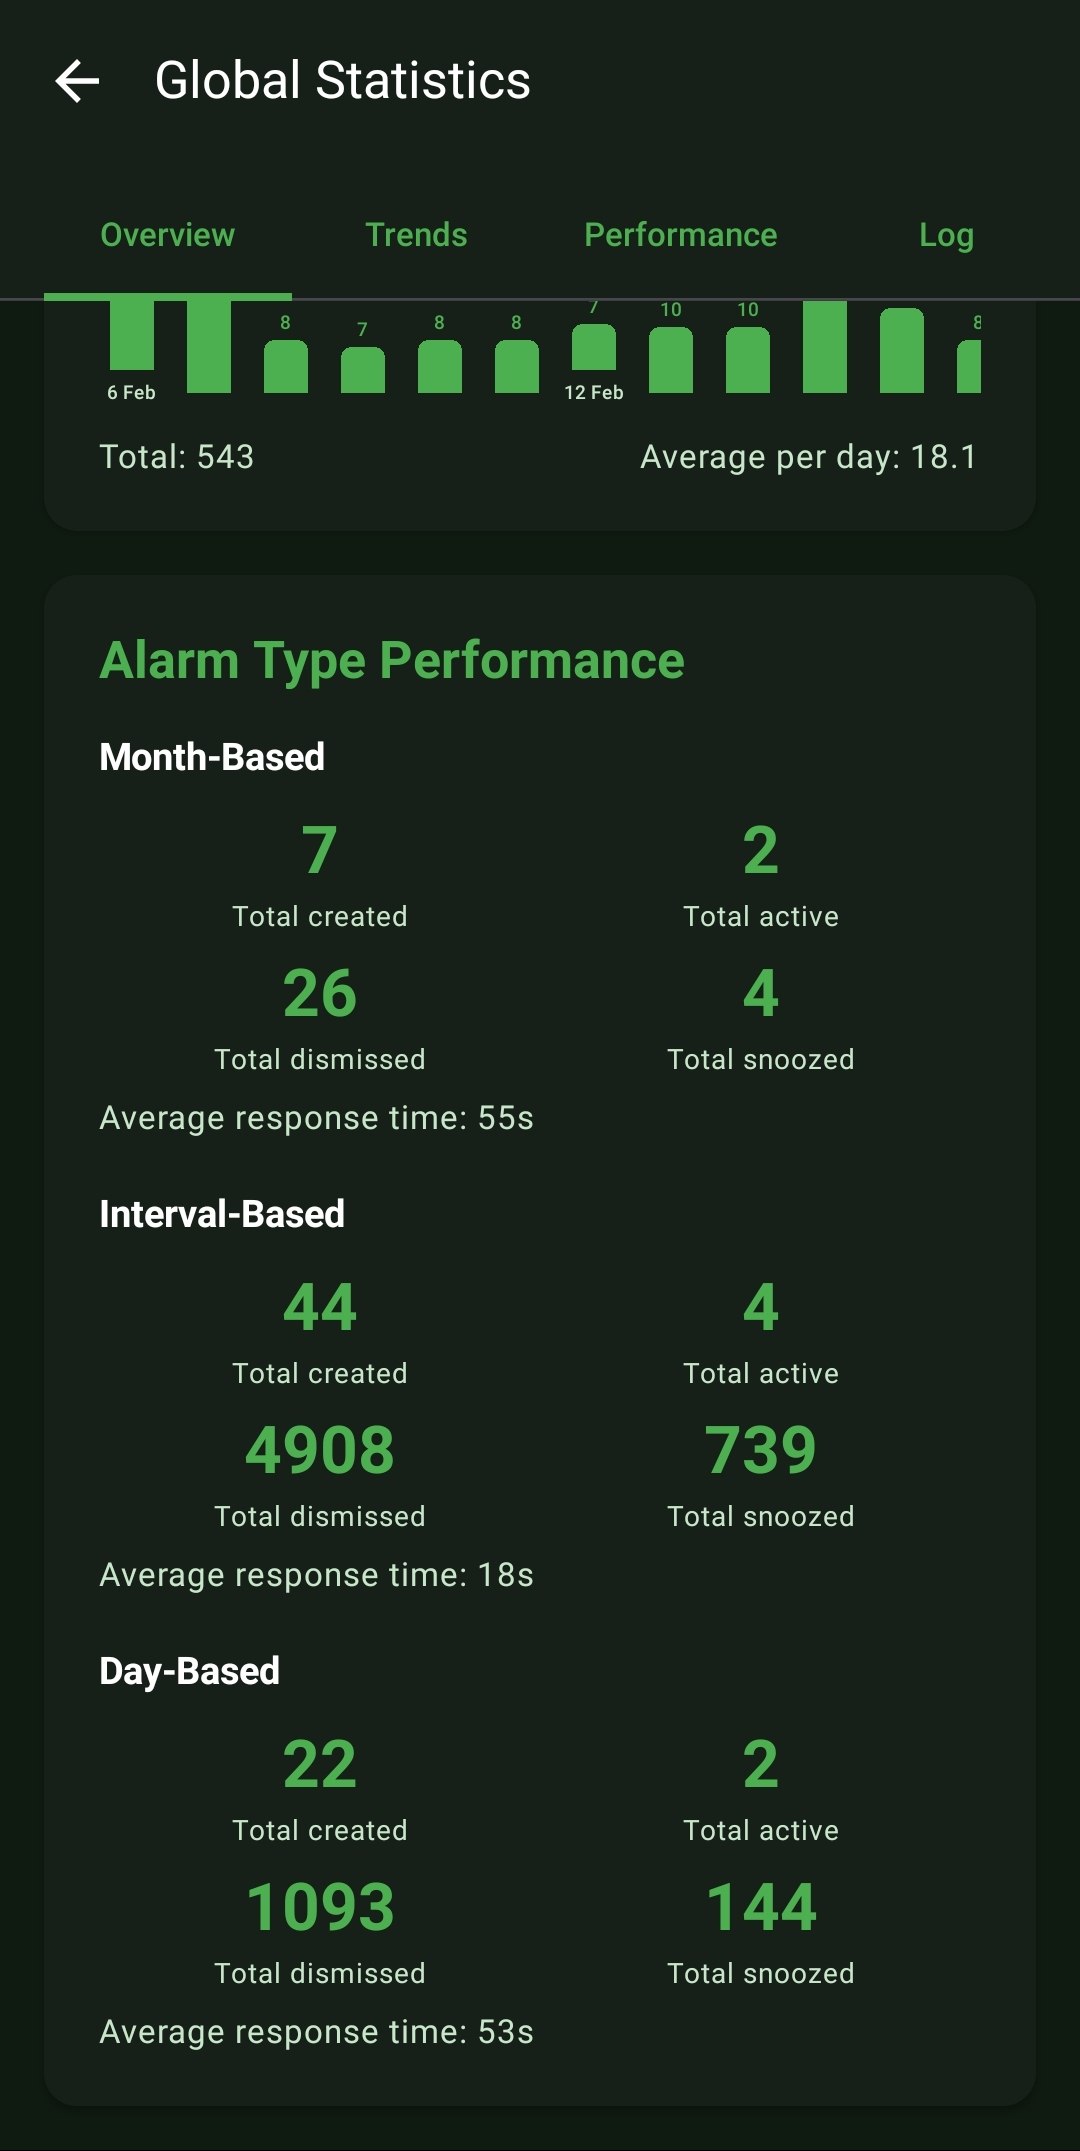
  • Complete Overview Summaries: Tracks your lifetime metrics, including Total Alarms Created, Total Dismissals, Active Alarms, and Total Snoozes.
  • Alarm Type Breakdowns: Visualizes exactly what types of alarms (Day-Based, Interval-Based, or Month-Based) orchestrate your life via interactive donut charts.
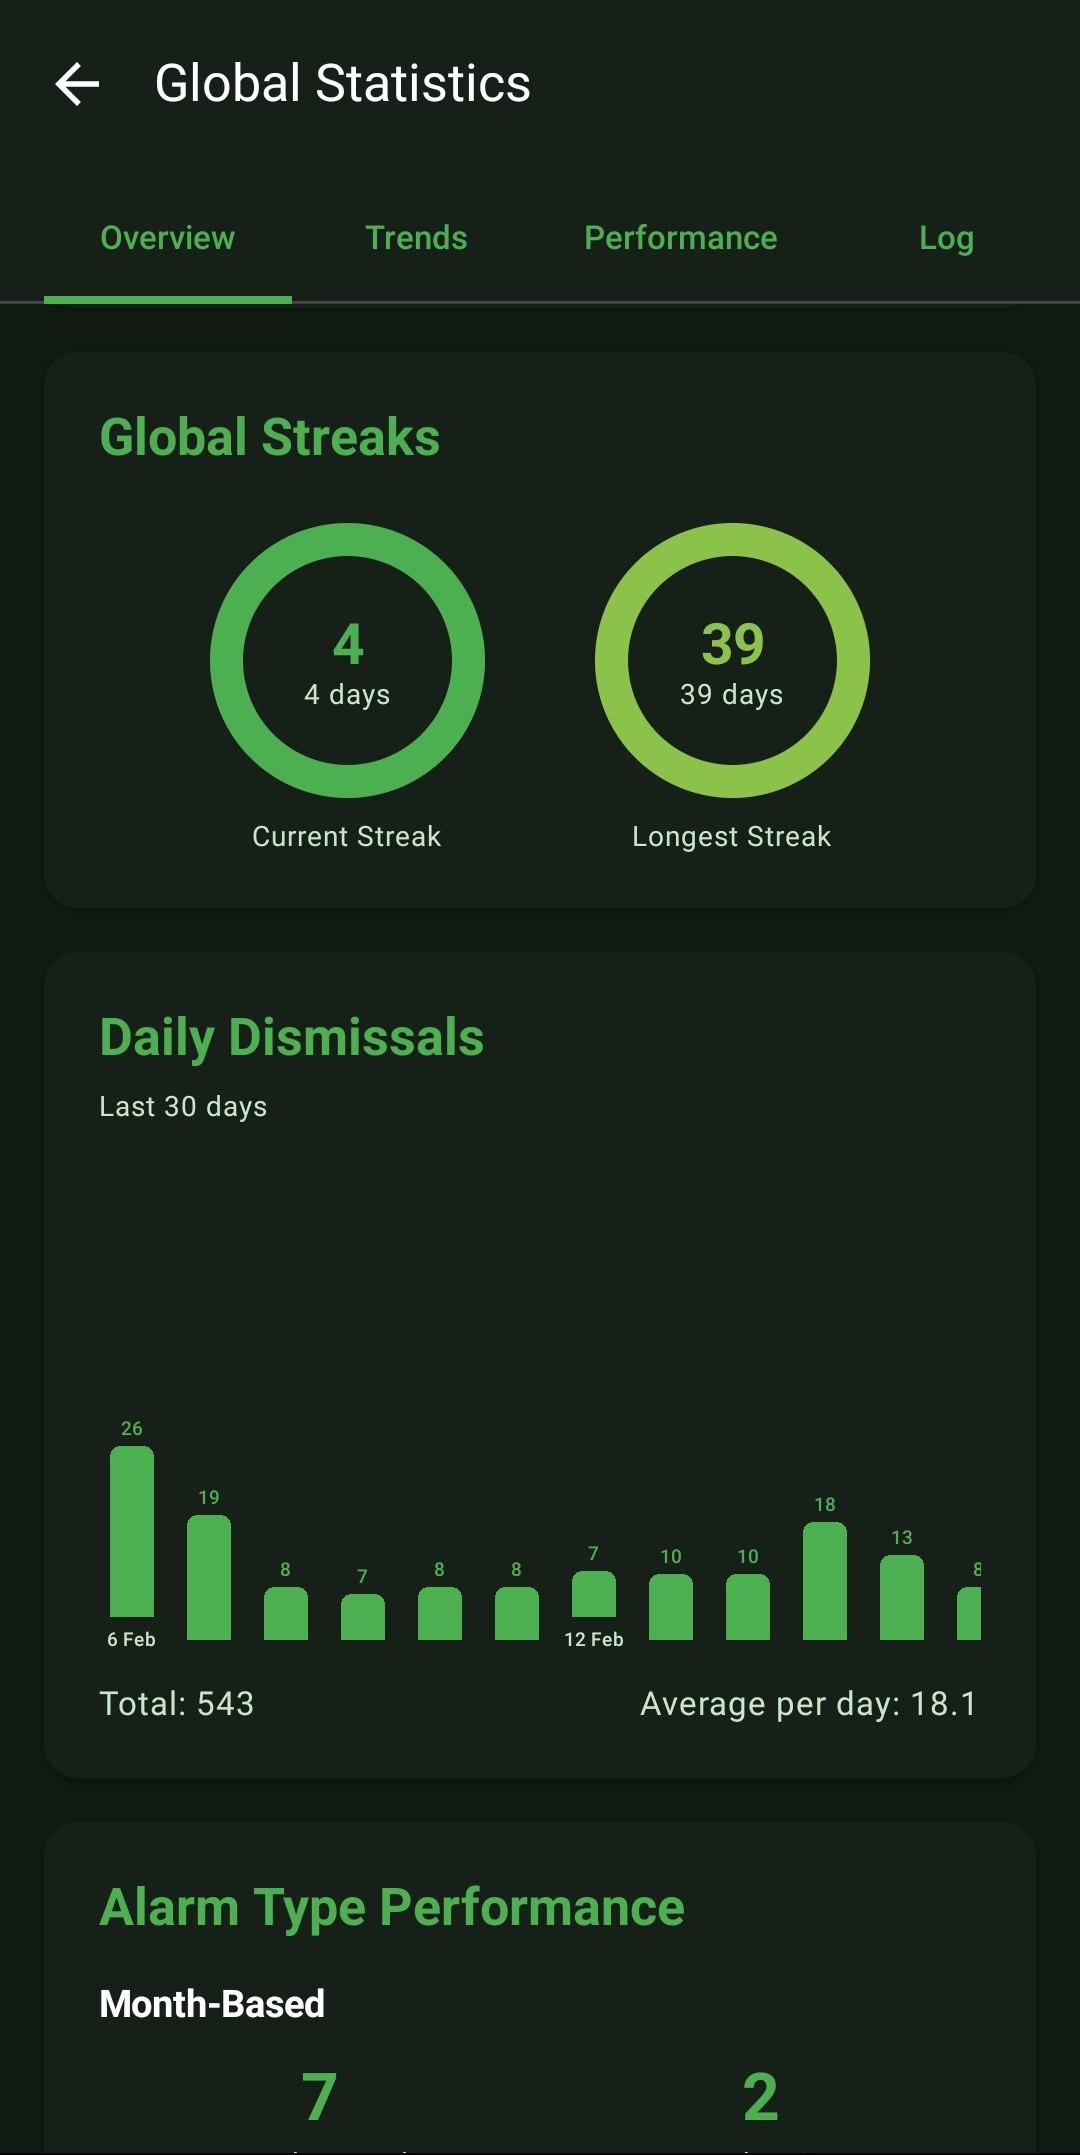
  • Global Streaks: Gamifies your discipline by tracking your 'Current Streak' and 'Longest Streak' of consecutive days where you woke up successfully without failing the system.
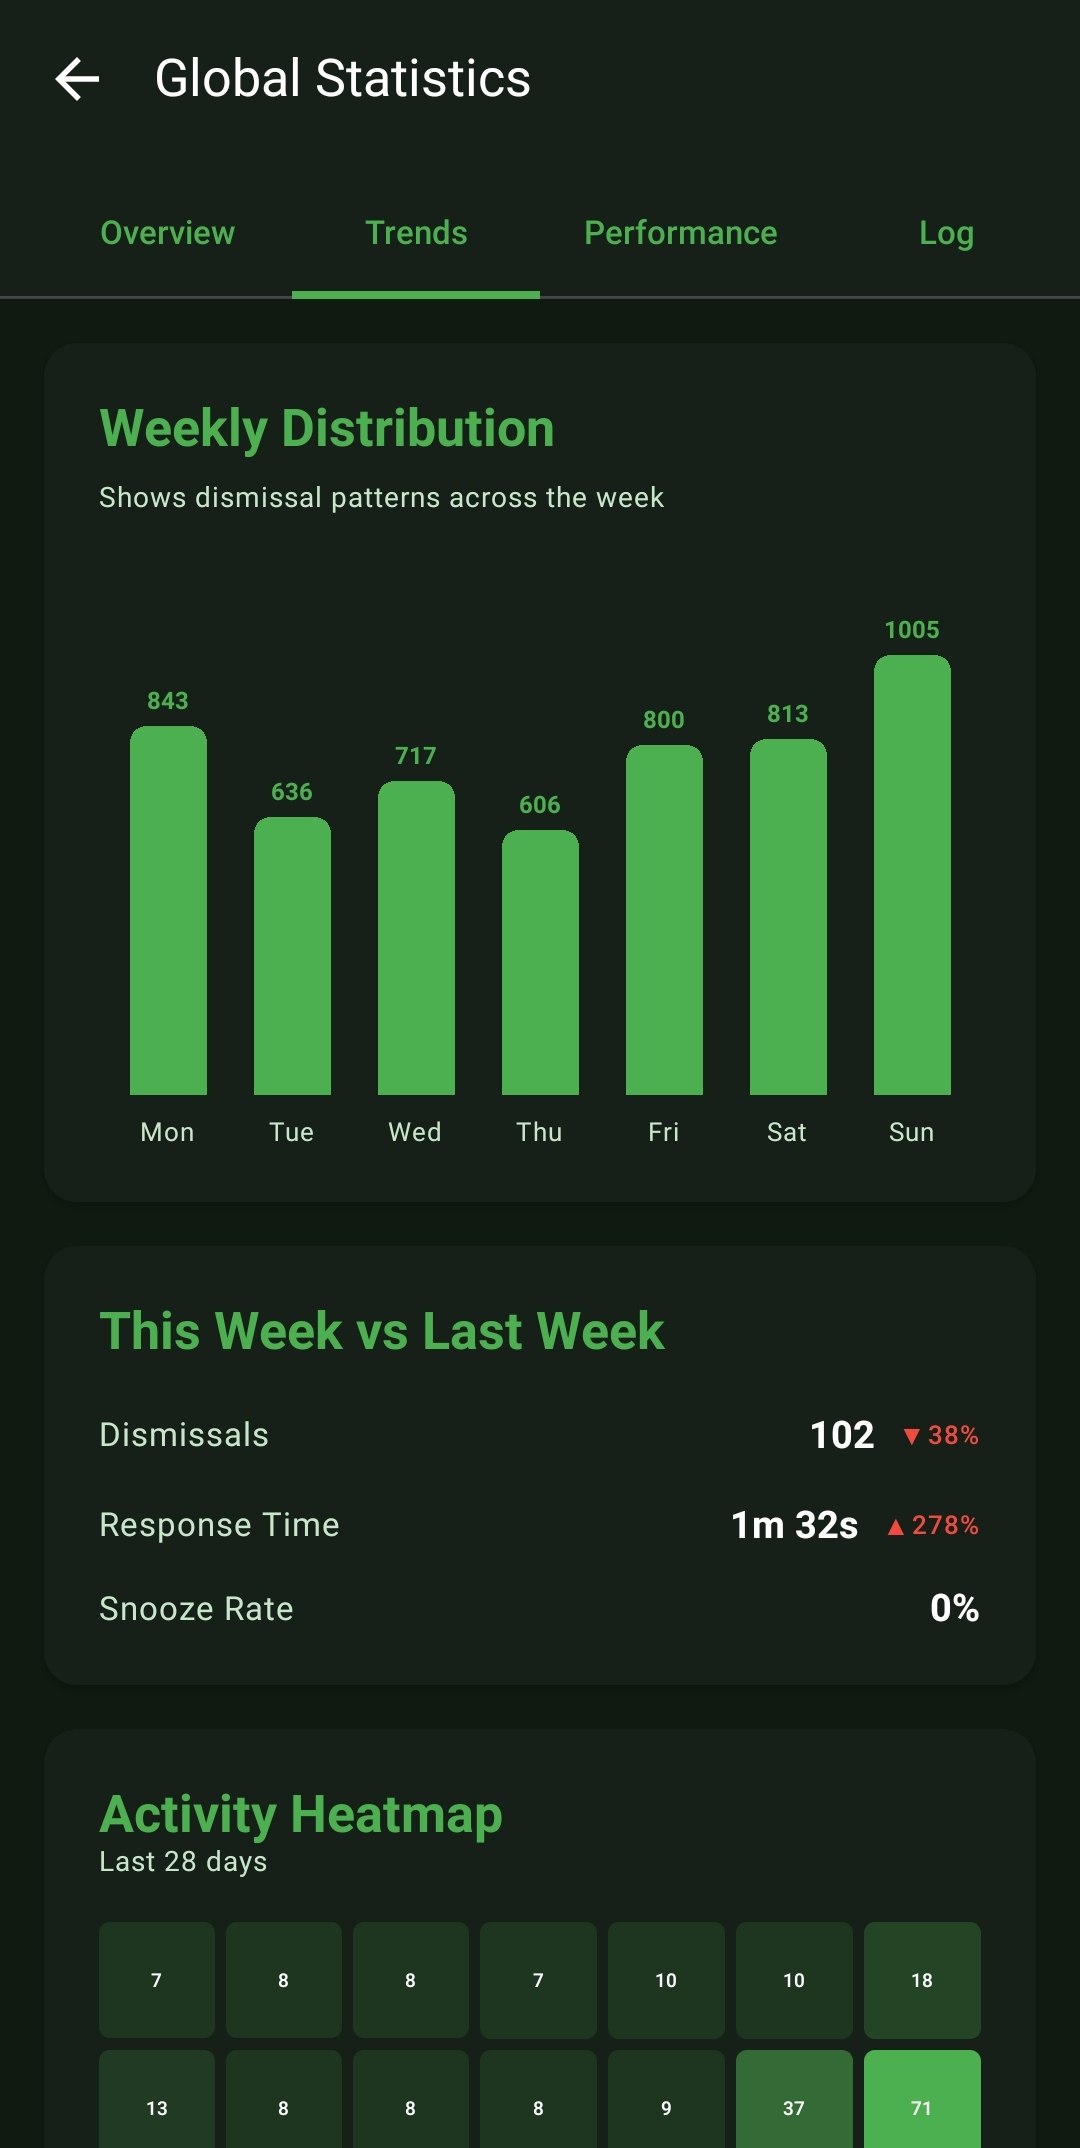
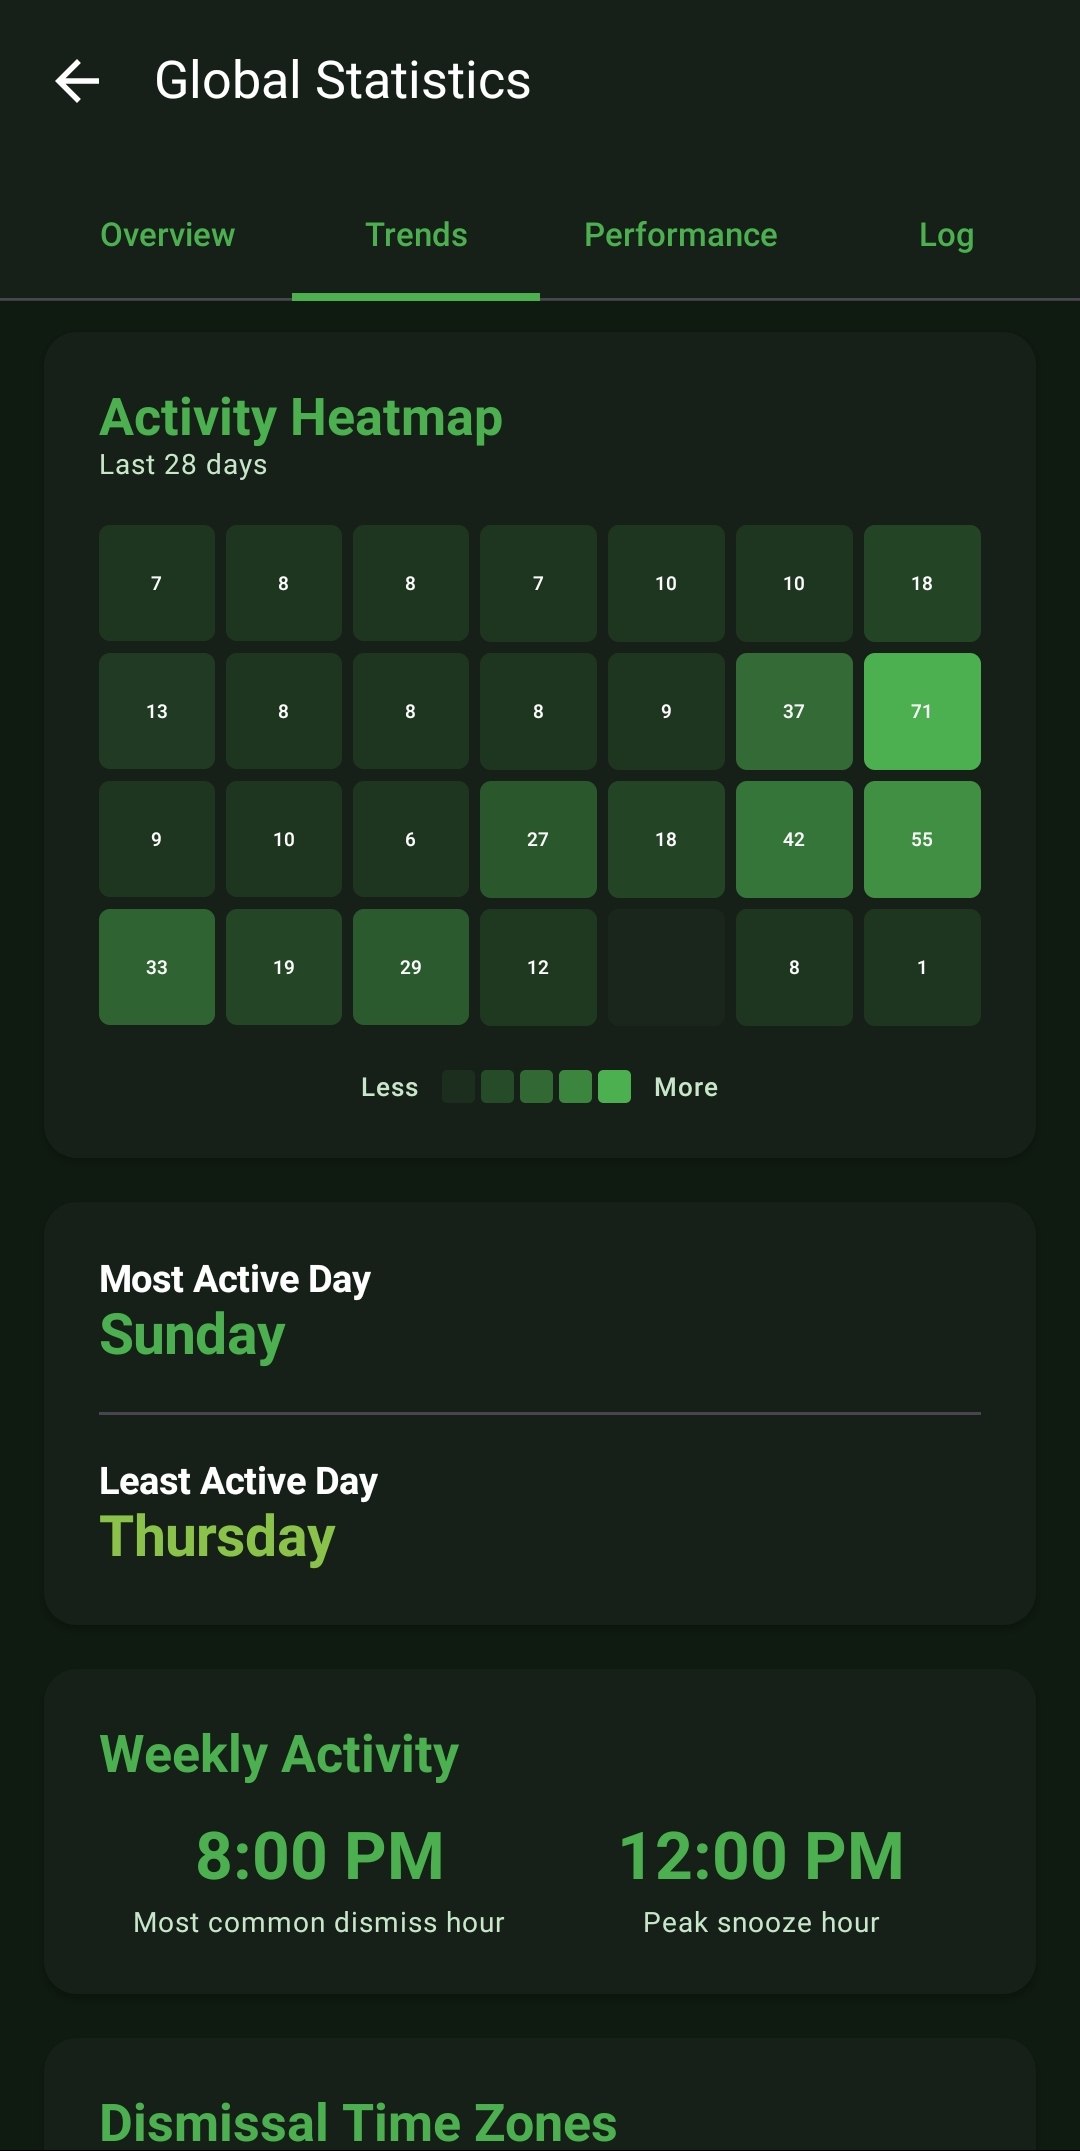
  • Trends & Activity Heatmaps: Graphs your Daily Dismissals over a 30-day timeline and constructs an 'Activity Heatmap' visualizing your busiest days over a 28-day grid.
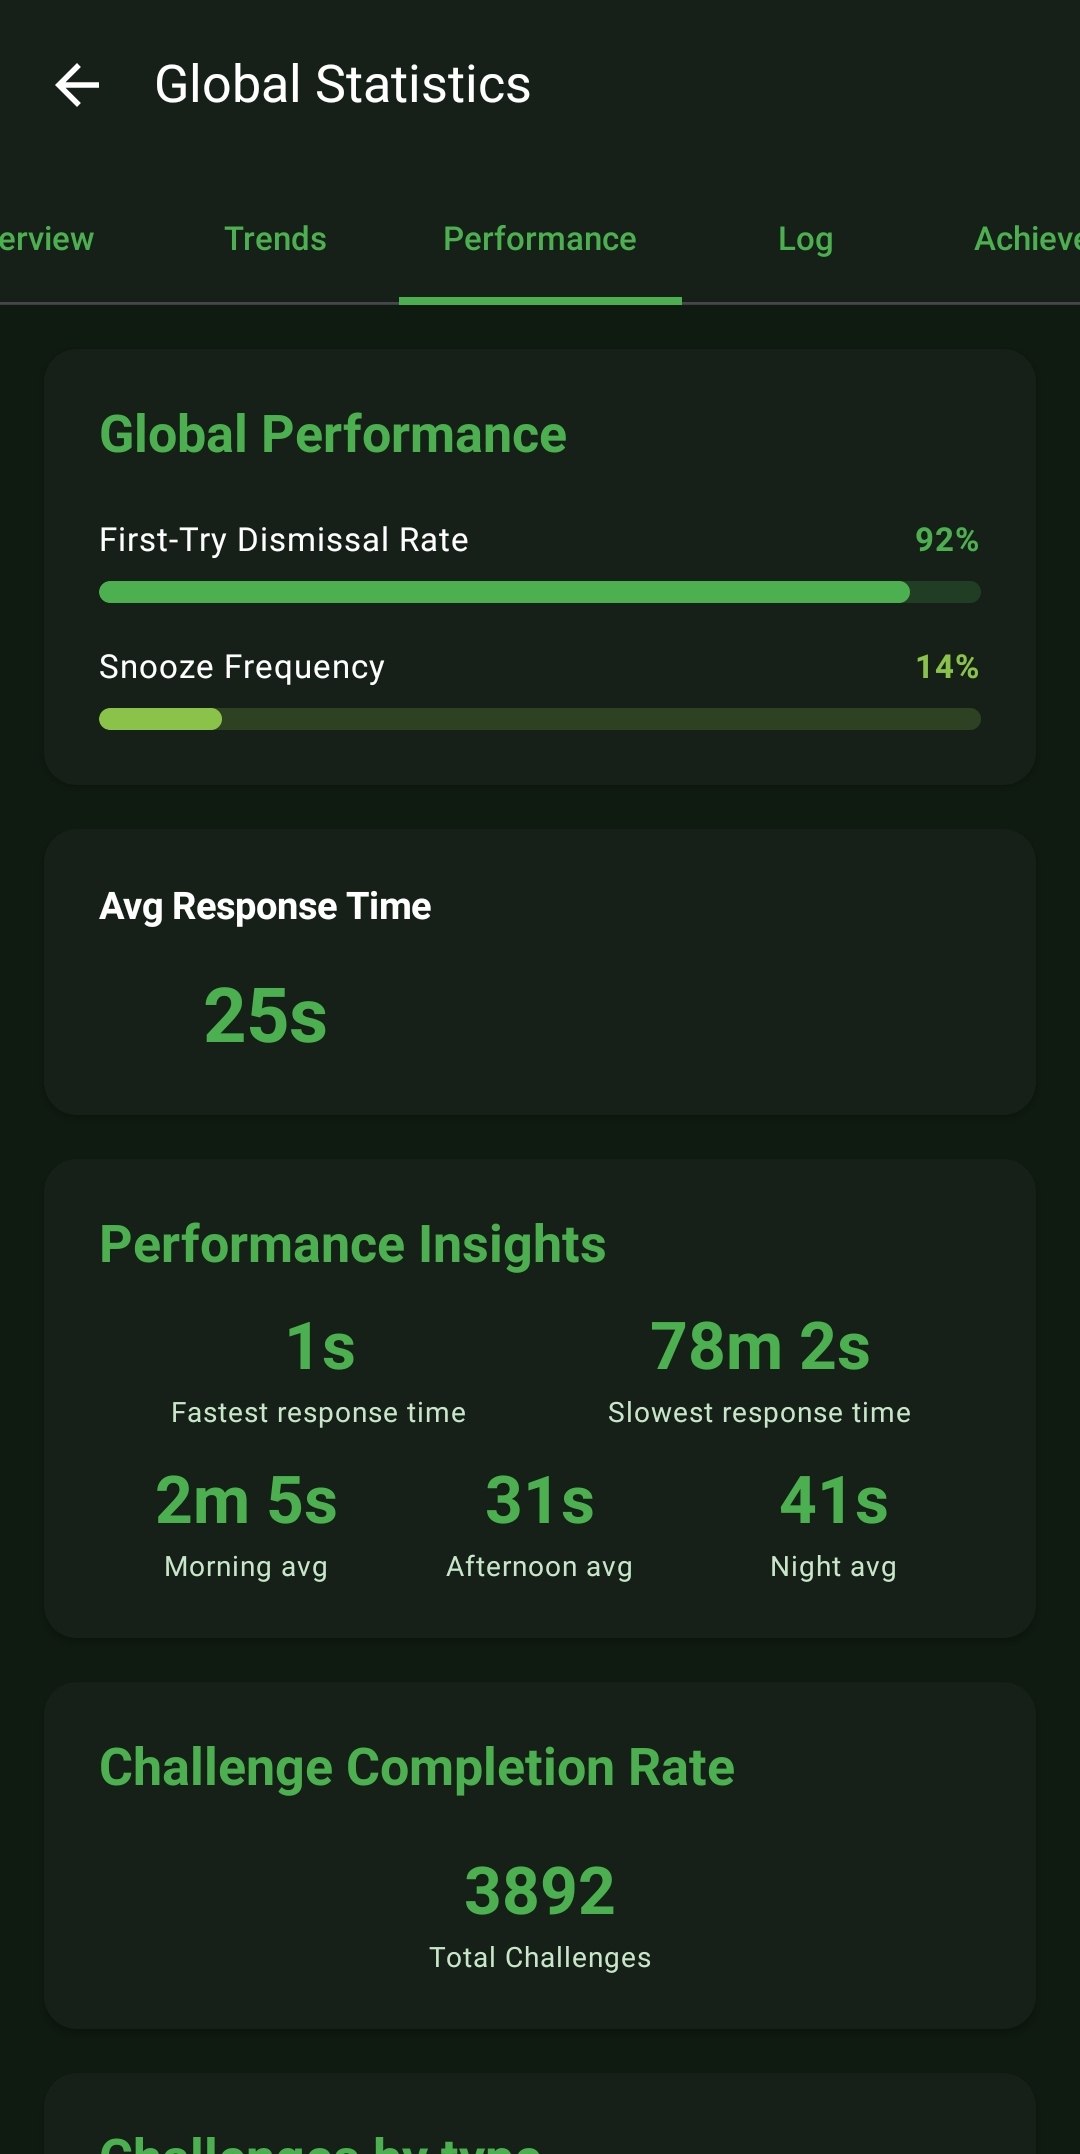
  • Deep Performance Analytics: Tracks your First-Try Dismissal Rate, Snooze Frequency, and your exact Average Response Time down to the precise second.
  • Time-Based Insights: Breaks down your performance by Morning, Afternoon, and Night averages, isolating your Fastest and Slowest absolute response times.
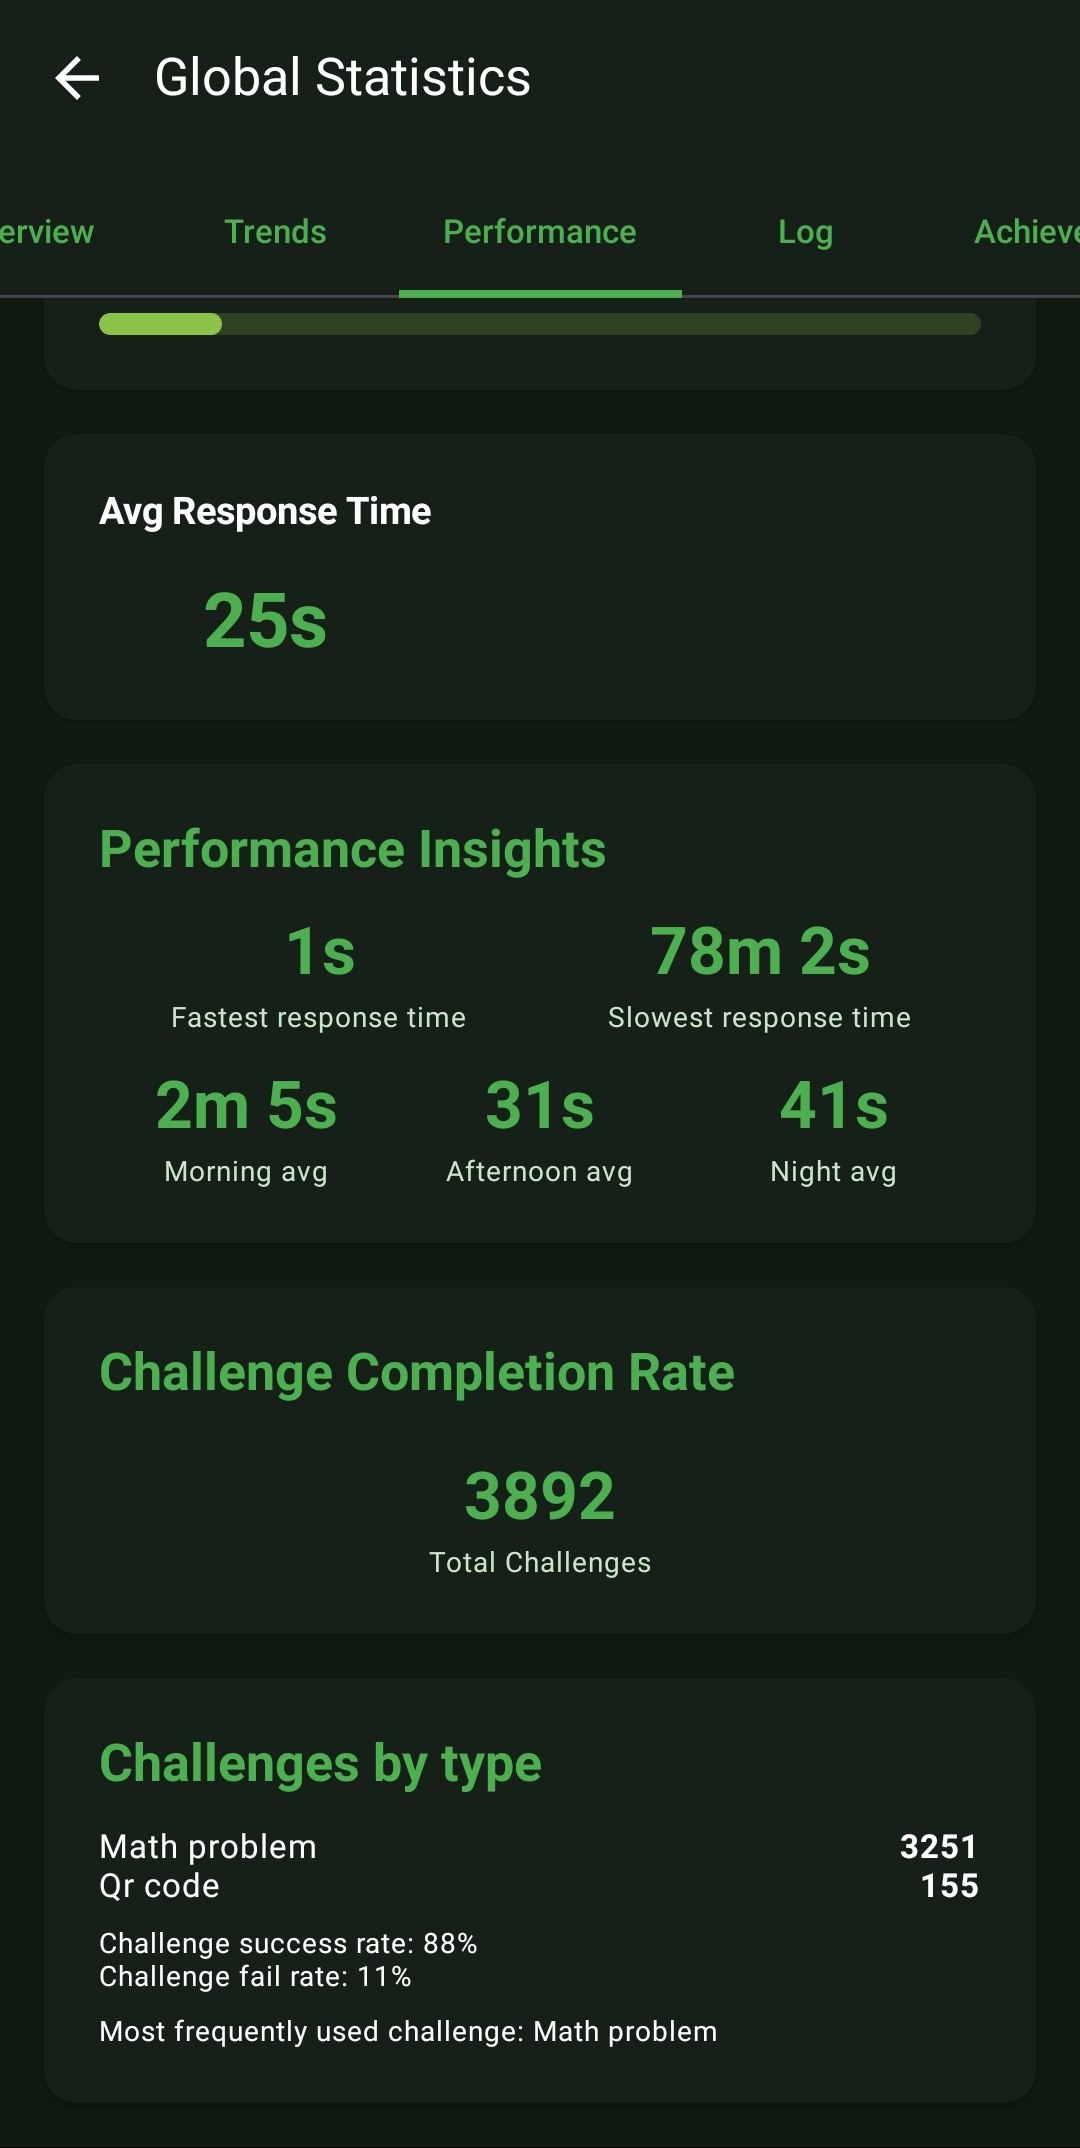
  • Challenge Analytics: Monitors your overall Challenge Completion Rate, breaking down exactly which challenge types (e.g., Math vs. QR) you succeed or fail at most frequently.
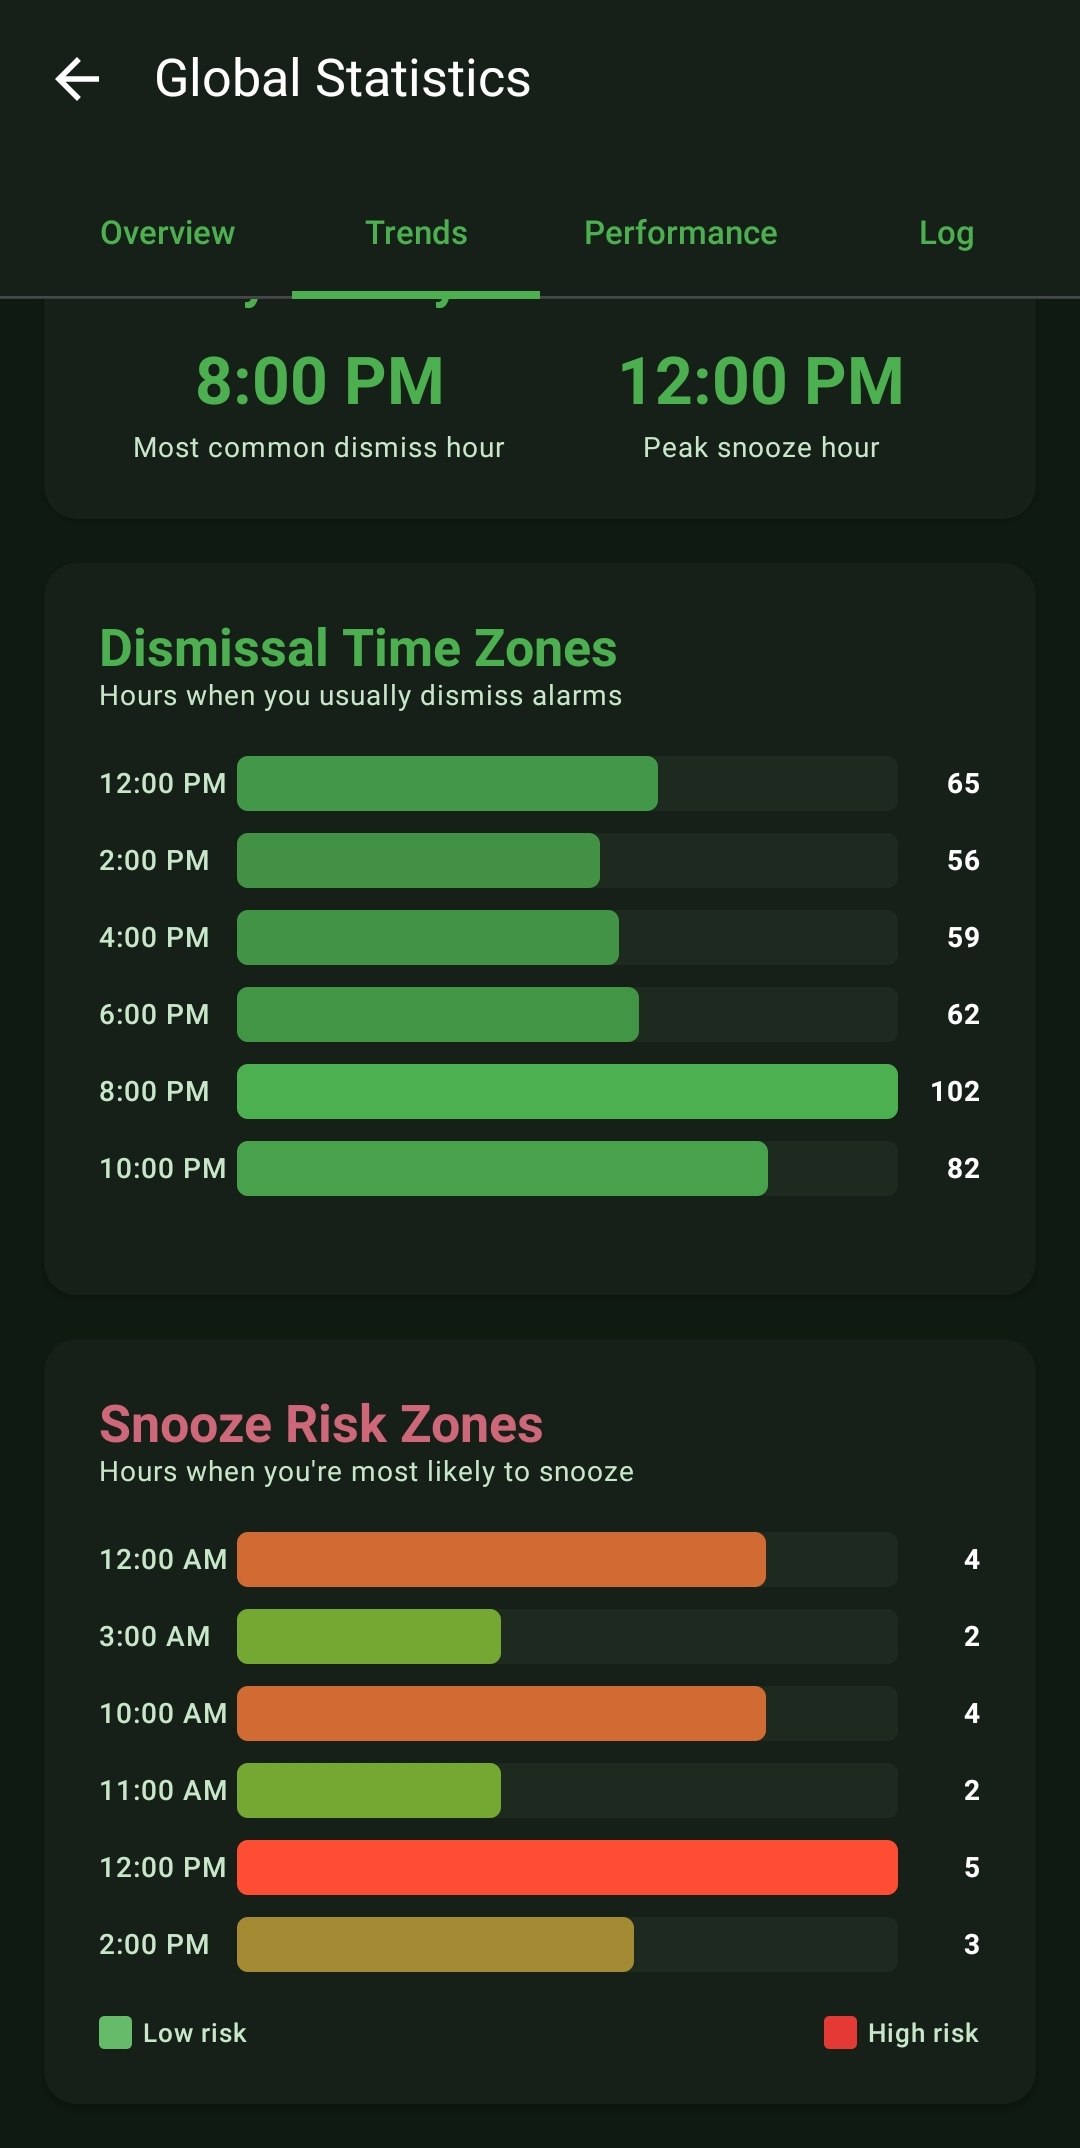
  • Snooze Risk Zones: An incredibly powerful trend graph analyzing what precise hours of the day (e.g., 12:00 PM) you are at the highest statistical risk of snoozing, allowing you to prepare mentally.
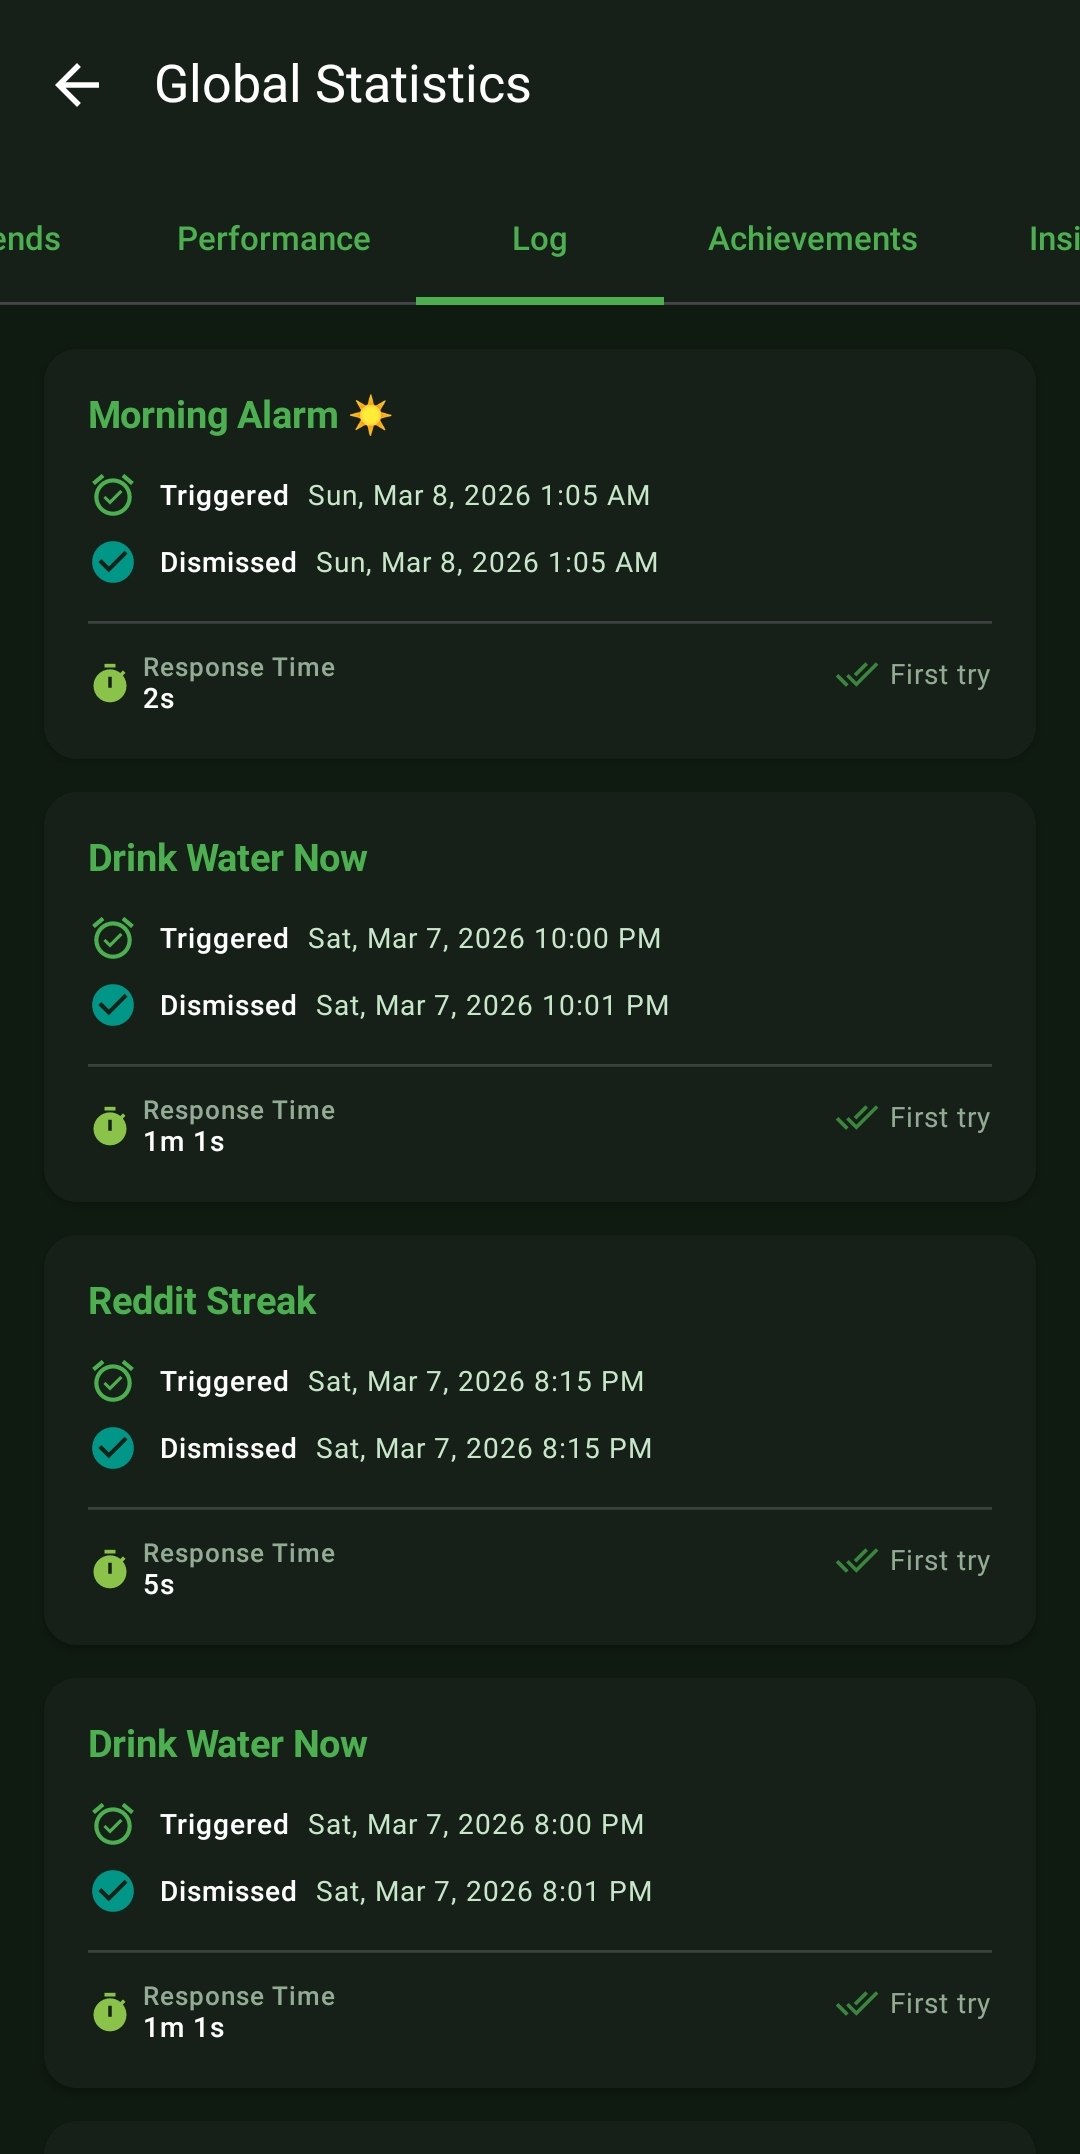
  • Event Logs: A raw, chronological ledger of every single alarm event, detailing exactly when an alarm triggered, when it was dismissed, and your exact response time for that specific event.
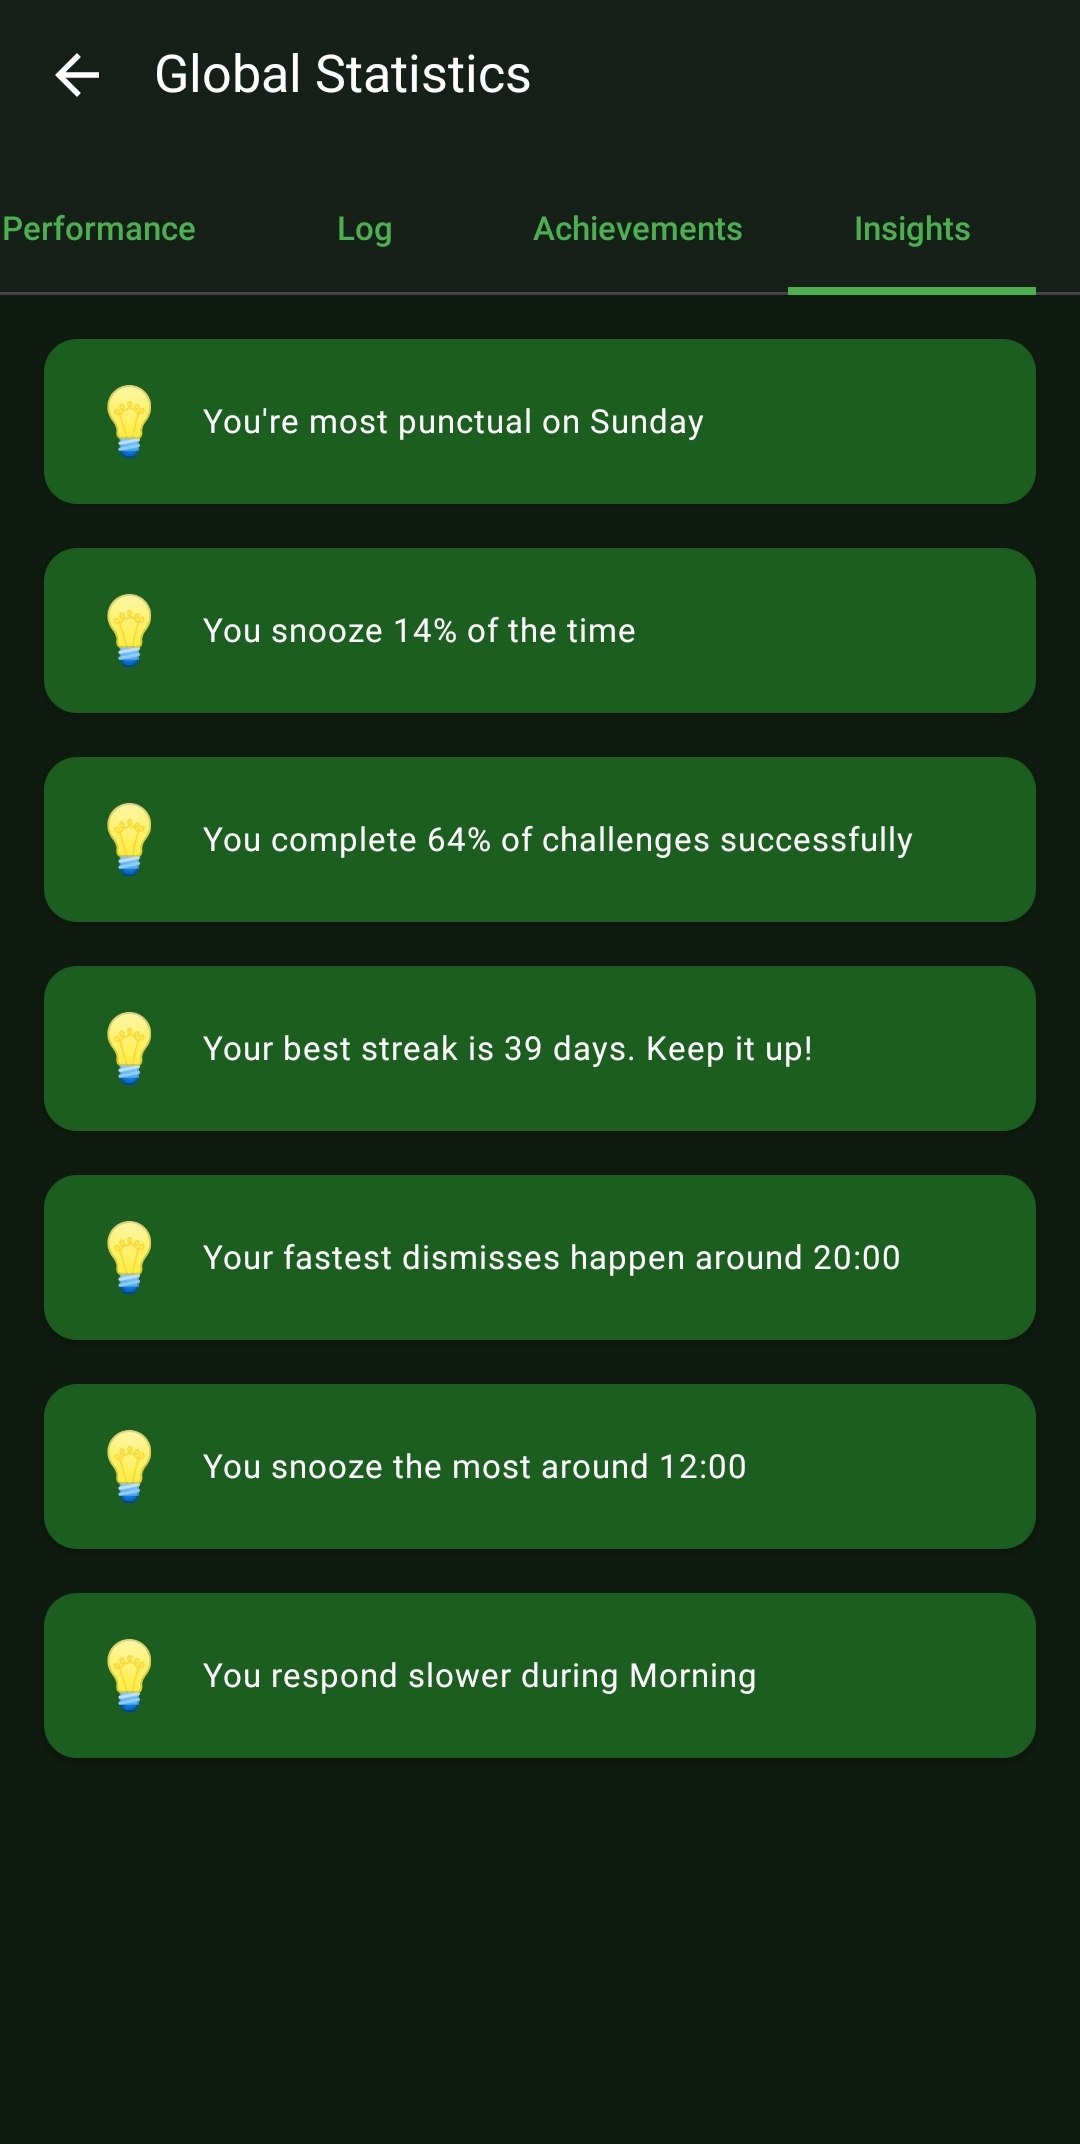
  • Textual Intelligence: The 'Insights' tab processes all of this data to give you simple, actionable sentences like: 'You respond slower during the Morning,' or 'You snooze the most around 12:00.'

How to Setup

  1. This massive engine runs entirely automatically in the background from the very first alarm you set.
  2. To view your data, open the main navigation drawer menu and tap 'Global Statistics'.
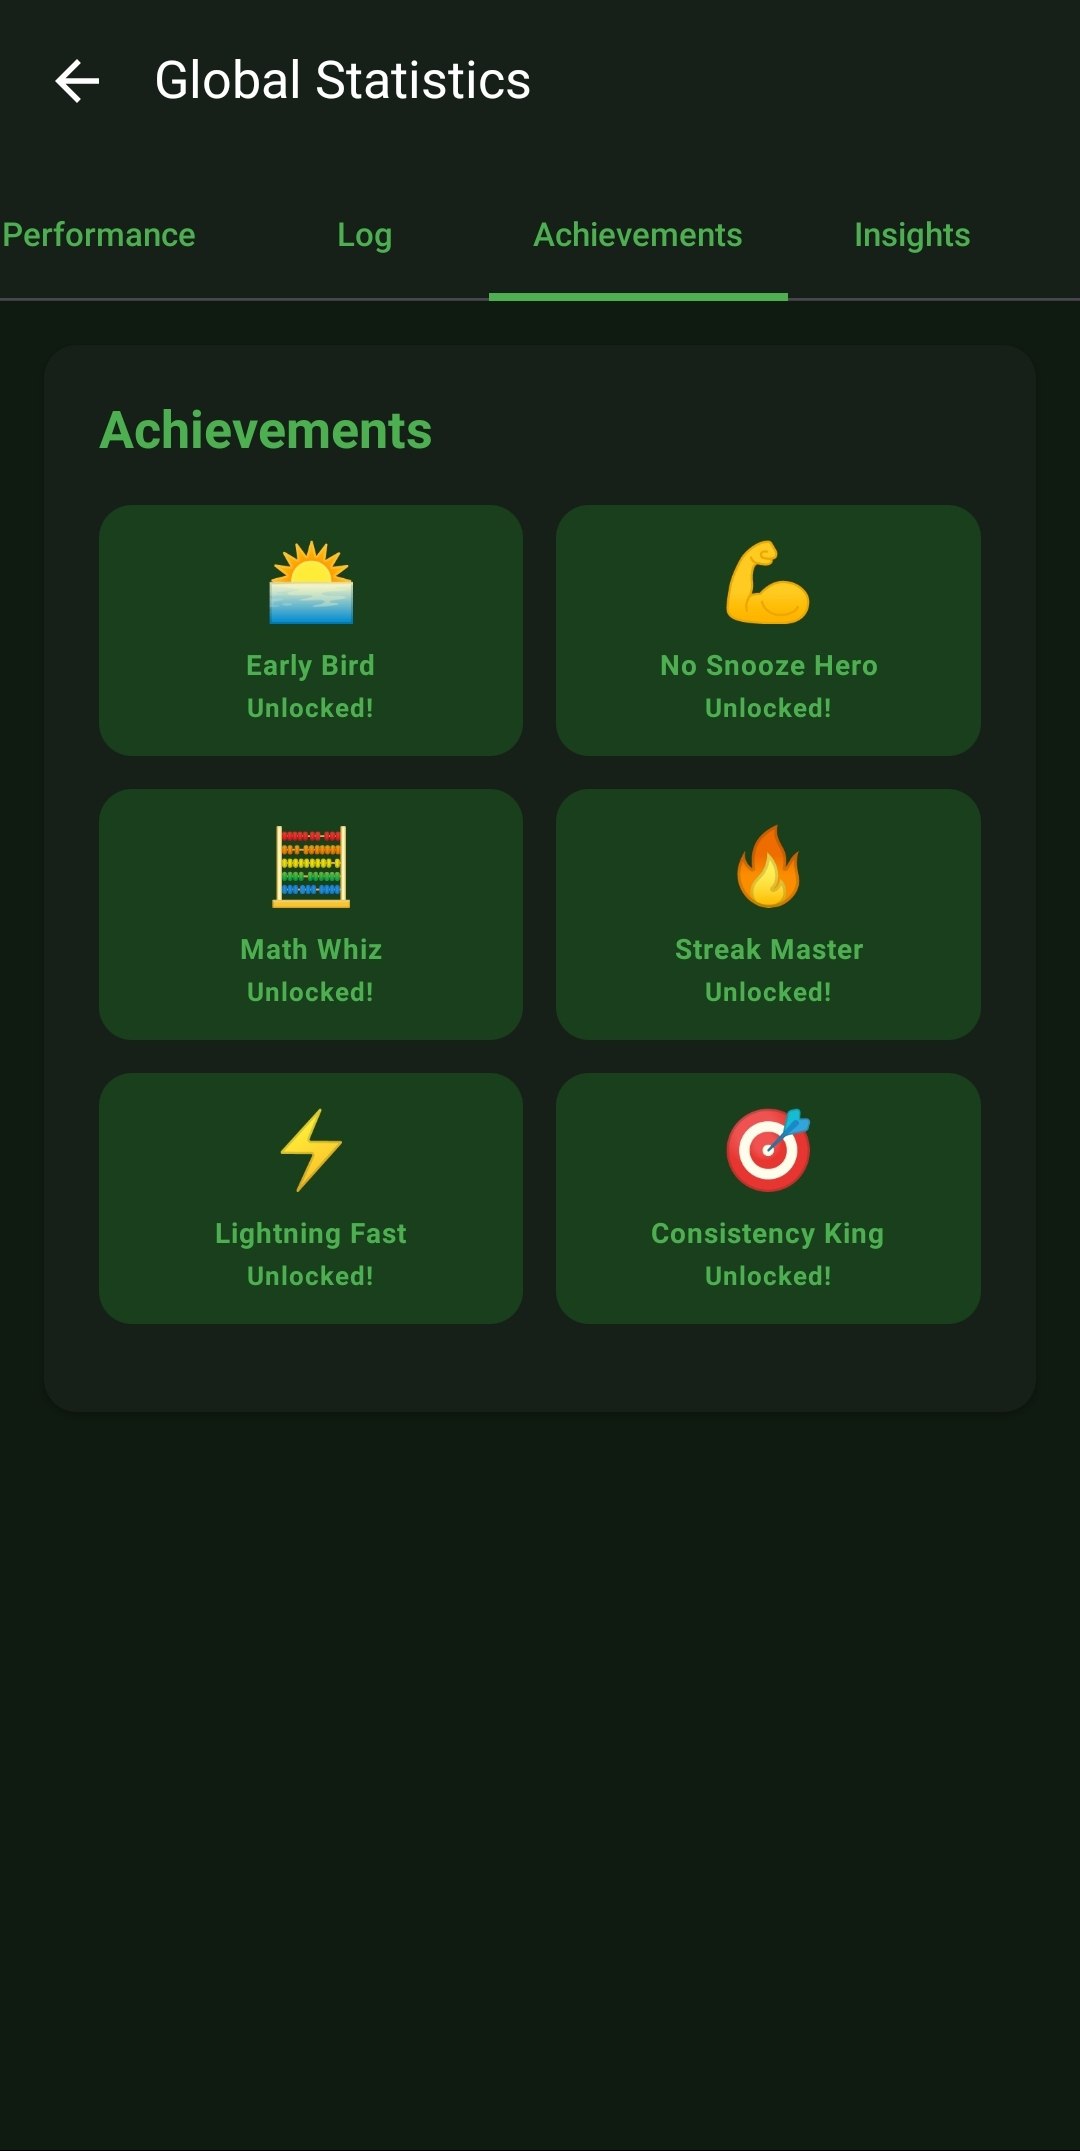
  3. Swipe left and right across the top navigation bar to cycle through the Overview, Trends, Performance, Log, Achievements, and Insights tabs.

Use Cases

Behavior Modification: If you review your 'Snooze Risk Zones' and see a massive red spike at 6:00 AM every Wednesday, you mathematically know that you need to go to sleep earlier on Tuesday nights. The data doesn't lie.

Accountability Logging: Did you really sleep through your alarm, or did you sleep-dismiss it? The raw 'Log' tab will prove exactly what happened at 1:05 AM down to the second.

Screenshots

The Overview tab summarizing lifetime totals and visualizing the breakdown of Active Alarm types.
Tracking gamified Global Streaks and graphing a 30-day timeline of Daily Dismissals.
The Trends tab showcasing your Weekly Distribution patterns and calculating Week-over-Week changes in response times.
A 28-day Activity Heatmap alongside metrics identifying your Most Active and Least Active days of the week.
Highly tactical tracking: Dismissal Time Zones identifying your most common dismiss hours, and the critical 'Snooze Risk Zones' highlighting high-risk failure times.
Deep analytics breaking down the exact performance (Total created, dismissed, snoozed, avg response time) segmented specifically by Alarm Type.
The Performance tab defining your First-Try Dismissal percentage and overall overall Snooze frequency limit.
Incredible granularity: Tracking your absolute fastest and slowest response times, segmented automatically by Morning, Afternoon, and Night averages. Highlighted is the Challenge Completion mapping.
The Log tab: A raw chronological ledger proving exactly when an alarm triggered, when it was handled, and the specific response time for that isolated event.
The Achievements UI: Gamifying the hardest part of the day by unlocking visual badges (e.g., Early Bird, Streak Master) for maintaining unyielding consistency.
The Insights tab: Translating the raw database into simple, actionable sentences highlighting exactly where you succeed and when you struggle the most.

Frequently Asked Questions

Does tracking all of this data drain my battery?
Absolutely not. ReAlarm efficiently logs these data points as lightweight database entries instantly when an alarm event occurs. There is no heavy background processing constantly running.
Is my sleep data private?
100%. All of these statistics, logs, and insights are generated and stored completely on-device. ReAlarm does not transmit your personal wake-up habits to external servers.
How is the 'First-Try Dismissal Rate' calculated?
This tracks the percentage of times you successfully complete all required challenges and dismiss the alarm on the very first attempt without ever hitting the snooze button or allowing the app to fallback into the Wake Up Check protocol.
What happens to my Global Streak if I use the 'Skip Next' feature on a scheduled alarm?
Using the proactive 'Skip Next' feature before the alarm triggers is considered responsible schedule management and will NOT break your Global Streak.
Why is my 'Snooze Risk Zone' showing high risk in the afternoon?
This indicates that historically, when interval or nap alarms trigger in the afternoon, you mathematically hit the snooze button far more frequently than you do for morning day-based alarms. It's an actionable insight telling you to strengthen your afternoon discipline!

Ready to Upgrade Your Morning?

Install ReAlarm today to unlock Global Statistics & Insights for free.

Get it on Google Play